
Interlocking shapes forming a unified picture, representing how business data comes together to reveal performance and trends.

Business performance reporting in TeamPoint: turning everyday data into better decisions

17.11.26inPlatform Capabilities
Written by
Portrait of a TeamPoint blog author for the Knowledge Centre.
Rosie Cottell
HOME/KNOWLEDGE CENTRE/business-performance-reporting-in-teampoint
Platform Capabilities17.11.26

Business performance reporting in TeamPoint: turning everyday data into better decisions

This guide explores TeamPoint's business performance reporting for service and maintenance companies, from sales conversion and customer trends to job profitability, operational efficiency and long-term growth.

Every quotation, completed job, timesheet and invoice tells part of the story of how a business is performing. The difficulty, particularly as a company grows, is seeing the story as a whole. Which work is profitable? Are customers spending more or less than they used to? Is the team completing more jobs without spending more time travelling? And is that growth translating into a healthier business?

TeamPoint brings day-to-day operational and financial information into dashboards, charts, key performance indicators (KPIs) and reports. Instead of assembling figures from disconnected spreadsheets or relying on impressions, managers can examine what is happening, compare periods and investigate the reasons behind changes.

This guide explores TeamPoint's business performance reporting for service and maintenance companies, from sales conversion and customer trends to job profitability, operational efficiency and long-term growth. It also includes a directory of the 44 standard reports listed in the November 2026 version of TeamPoint.
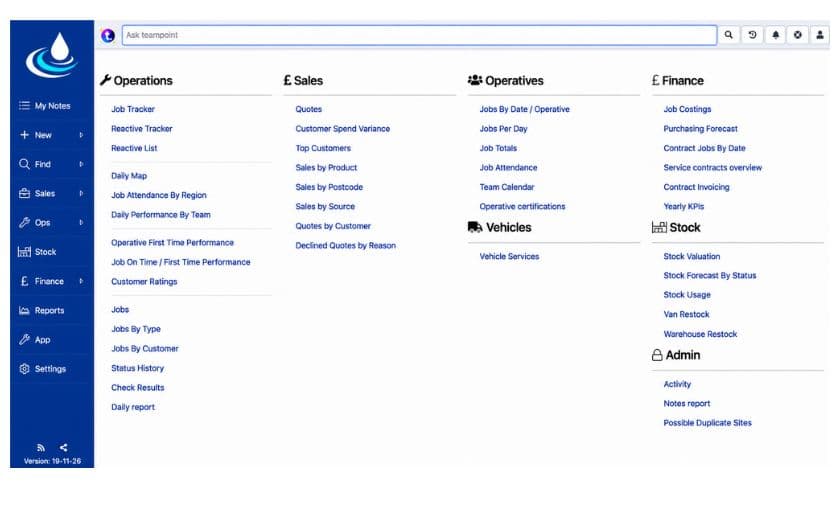
How TeamPoint organises business reporting

TeamPoint organises its standard reports into seven categories: Operations, Sales, Operatives, Vehicles, Finance, Stock and Admin. Further information is available within individual jobs, projects and service contracts, while homepage panels can put frequently needed figures in front of the people who use them. Where a business needs something more specific, bespoke reports can be built from the information it already records.

TeamPoint reporting dashboard showing 44 standard reports across seven categories: Operations, Sales, Operatives, Vehicles, Finance, Stock and Admin.
Reports categories

The reports serve different purposes. A drainage contractor might review first-time completion and travelling time; a facilities management company may need to understand service contracts and response times across hundreds of sites; a roofing contractor may be more concerned with project expenditure, variations and margins. The advantage of recording these activities in one job management system is that a manager can move from the headline figure to the work behind it.

For Defluo Group, a drainage and property services business, better information exposed a substantial backlog of jobs that had not been properly tracked. As Scott Fixter of Defluo Group explained:

We didn’t really have the tools or the reporting or the functionality to know that these jobs were sitting there.

Scott Fixter from Defluo GroupScott Fixter, Operations DirectorDefluo Group

Once the outstanding work became visible and could be processed, he described the effect on turnover:

Within three or four months, we just saw our turnover literally go bang.

Scott Fixter from Defluo GroupScott Fixter, Operations DirectorDefluo Group

The work was already there. The difference was recognising it and getting it through the business. That is a useful illustration of reporting's commercial value: not a collection of figures for its own sake, but information that reveals what needs attention.

Sales reporting and customer performance

Winning profitable work starts before a job is scheduled. Enquiries, prospects and quotations all provide useful information about where opportunities come from and how successfully they are converted into business. TeamPoint records prospects and quotation activity so that sales performance can be examined rather than judged solely by the value of work coming in.

What are your quotations telling you?

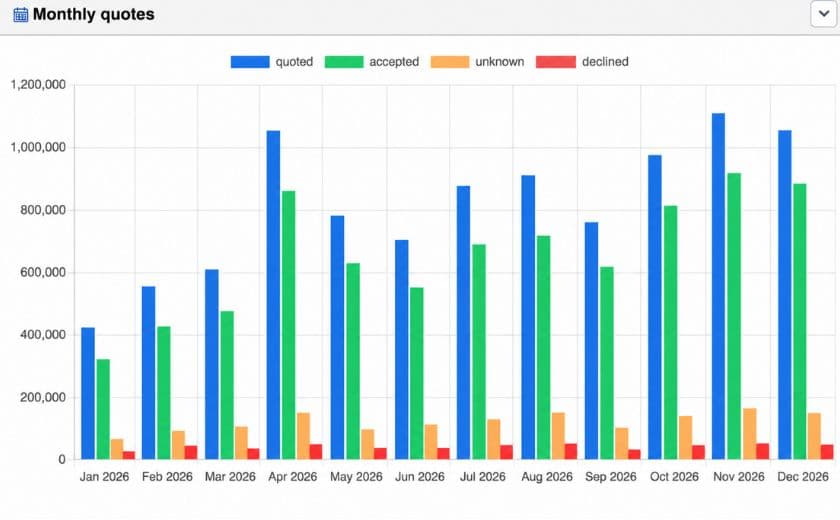
TeamPoint tracks quotations as they progress through the sales process. Quotation conversion can be assessed by both number and value: winning eight out of ten quotations sounds promising, but the result looks different if the two that were declined were worth more than the eight accepted.

The Quotes report provides an overview of quotation activity, while Quotes by Customer helps managers examine opportunities associated with particular accounts. Sales by Source, Sales by Product and Sales by Postcode show where business originates, which products or services generate sales and where demand is concentrated. Declined Quotes by Reason adds a useful explanation of why opportunities are being lost.

What are your quotations telling you?
Sales reporting

Together, these reports can influence practical decisions about follow-up, pricing and marketing. A drainage company, for example, might find that commercial maintenance work generates fewer enquiries than domestic call-outs but produces greater contract value. That may be a reason to review how the company targets and develops those relationships, rather than automatically pursuing more enquiries of every kind.

Recognising changes in customer relationships

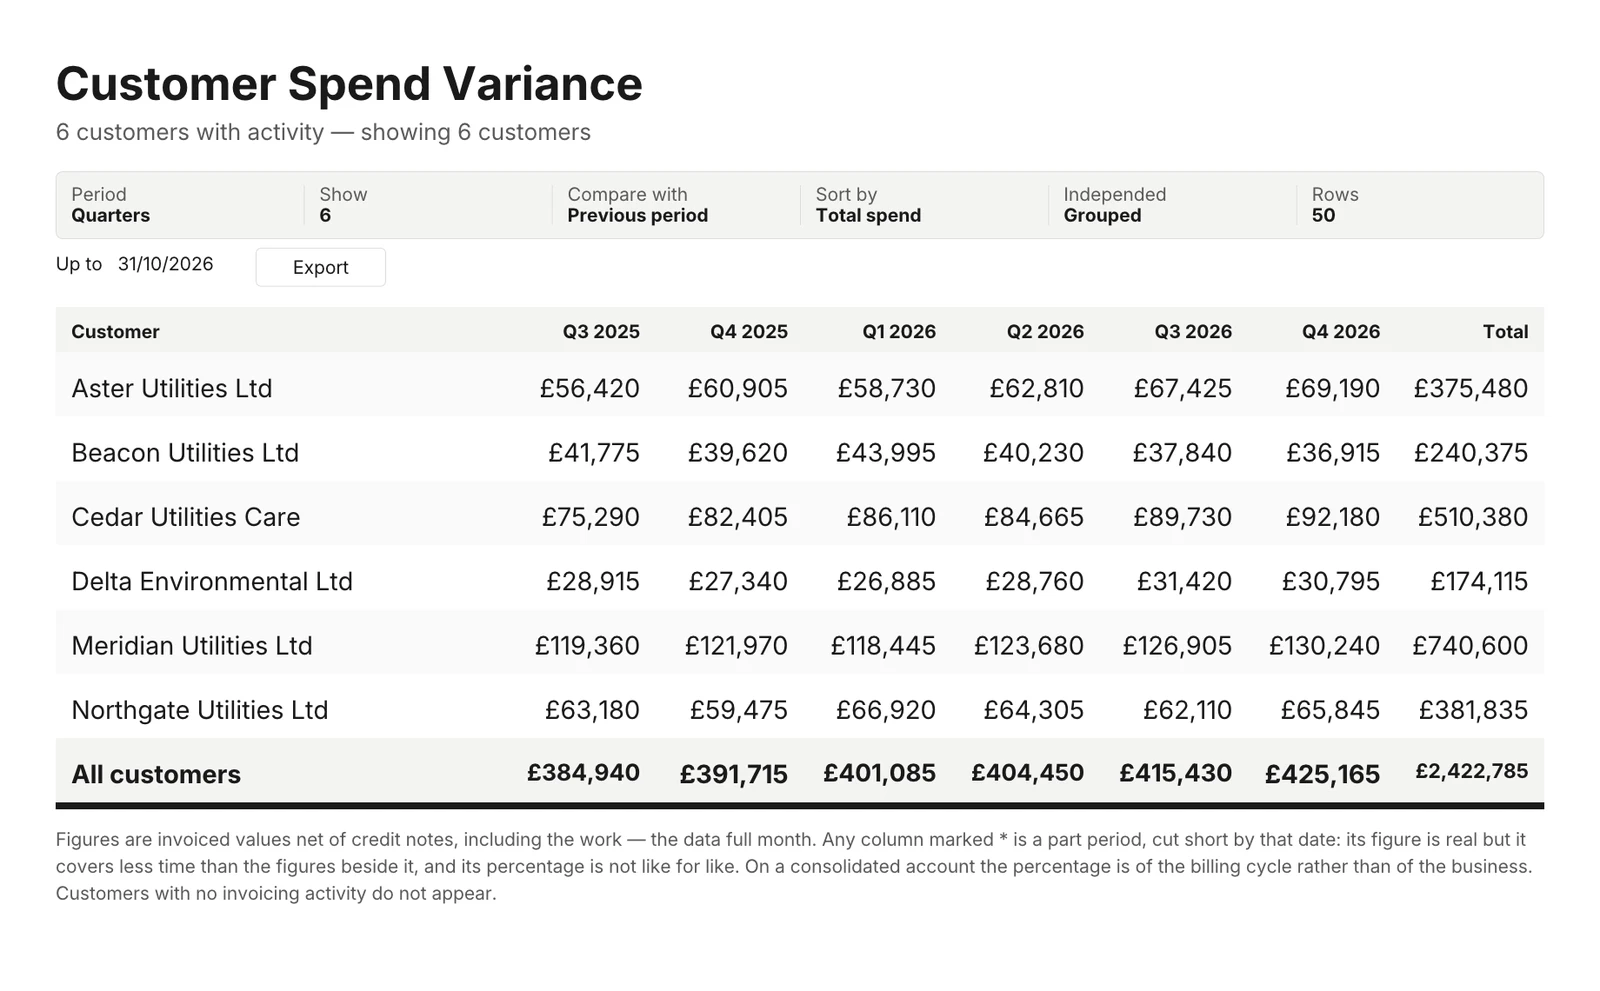
An established customer can gradually reduce the amount of work they give you without anyone immediately noticing. The Customer Spend Variance report compares invoiced spending across periods, accounting for credit notes. Alongside Top Customers and other customer-level sales reporting, it helps managers notice changes worth investigating.

Consider a building maintenance contractor working for a commercial property management firm. Jobs continue to arrive, but the figures show that the value of work has declined over the past year. Perhaps several buildings have been sold, a programme of planned maintenance has finished or certain repairs are now being allocated elsewhere. The report cannot tell the contractor which explanation is correct, but it provides an excellent reason to pick up the phone.

The reverse can be just as interesting. A customer who once requested occasional repairs may now be placing regular orders, suggesting an opportunity to discuss a longer-term service arrangement. Reporting helps a business pay attention to the relationships it already has, not just the next new enquiry.

TeamPoint Customer Spend Variance report comparing customer spending between periods.
TeamPoint Customer Spend Variance report showing quarterly spending trends for six example customers, highlighting increases and decreases in customer expenditure.

Further reading: From First Enquiry to Ongoing Service: Managing Customer Relationships in TeamPoint.

Operational reporting: jobs, productivity and quality

A full scheduling calendar tells an operations manager that work has been allocated. It does not, on its own, show whether appointments were attended on time, how often operatives returned to the same job or where the working day was spent. Those questions become increasingly important when hundreds or thousands of jobs are being delivered across multiple teams and locations.

First-time completion and reliable service

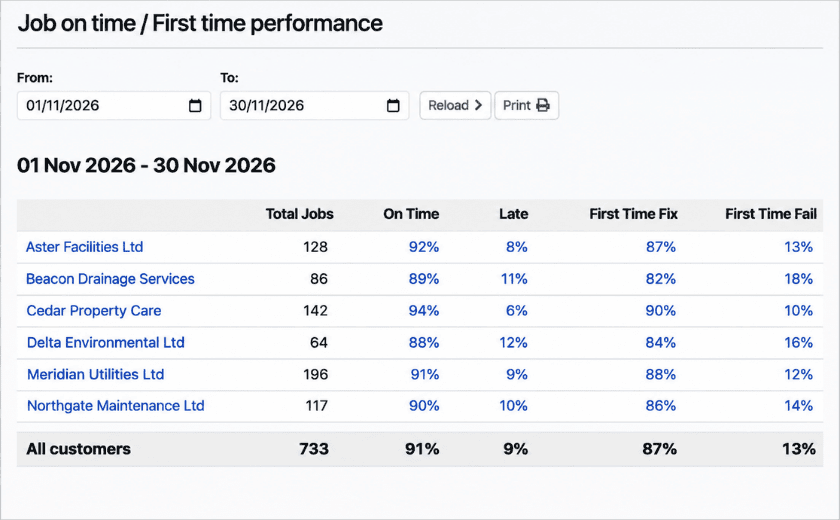
The Job On Time / First Time Performance and Operative First Time Performance reports help managers examine the reliability of job delivery. Job Attendance By Region, Reactive Tracker and Reactive List provide further ways to review attendance and reactive workloads, including how long reactive jobs have been waiting against their response times.

A facilities management company might discover that a particular category of repair regularly needs a second visit. The cause could be incomplete information from the initial enquiry, missing materials or specialist equipment that should have been identified in advance. Looking across jobs makes that pattern easier to recognise than treating every return visit as an isolated inconvenience.

TeamPoint Job On Time / First Time Performance report showing total jobs, on-time attendance, late arrivals and first-time completion rates across six example customers.
First-time completion

Improving first-time completion can reduce repeat appointments, travelling and customer disruption. The reports show where to investigate; managers can then decide whether the answer lies in job preparation, stock availability, scheduling or training.

Where does the working day go?

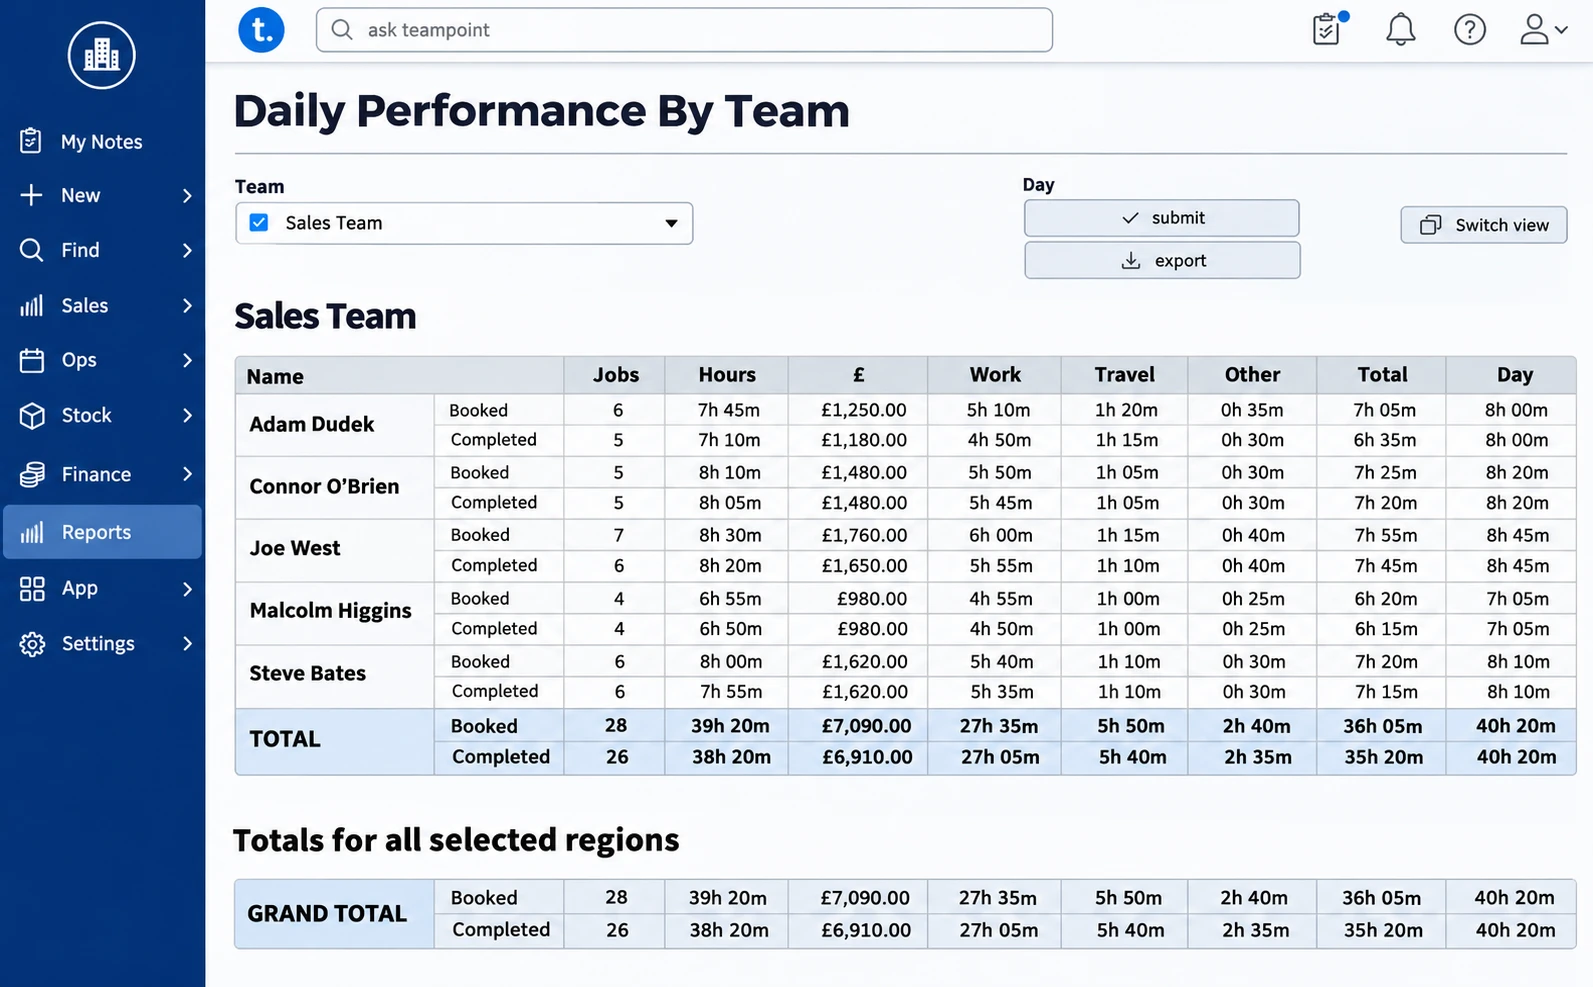
Daily Performance By Team brings together booked and completed jobs, working hours, travelling time and other recorded activities. Job Attendance, Jobs Per Day and Job Totals offer additional views of individual and team activity, while Daily Map helps put geographically dispersed work into context.

For a drainage company serving a wide area, a high proportion of travelling time might prompt a review of geographical scheduling or the way urgent work is allocated. The objective is not to rank operatives by the number of jobs completed: three complex repairs may be more demanding than six straightforward visits. It is to see how resources are being used and where a change might make the working day more productive. How the schedule is built in the first place is covered in From Planning to Dispatch: Scheduling in TeamPoint.

TeamPoint Daily Performance By Team report showing jobs and working time.

Quality is part of performance

Job volume alone is a poor measure of success if completed work leads to complaints or remedial visits. Customer Ratings provides a view of customer feedback, while Check Results examines the outcomes of configured checks with review forms: how often work passes first time, what fails and the reasons recorded. Operative certifications supports oversight of qualifications and renewals.

A roofing contractor could use repeated failed quality checks to identify an issue with a particular process, then review training or supervision. Combining these measures with productivity helps ensure that faster delivery does not come at the expense of workmanship or compliance. Checks, evidence and certifications are covered in more detail in Managing Compliance with TeamPoint: Checks, Evidence & Audit Trails.

Financial reporting: job costs and profitability

A growing turnover is encouraging, but it does not guarantee a growing profit. More work brings labour, materials, subcontractor and administrative costs. Unless those costs are examined alongside revenue, a busy company can find itself working harder for a disappointing return.

Which work actually makes money?

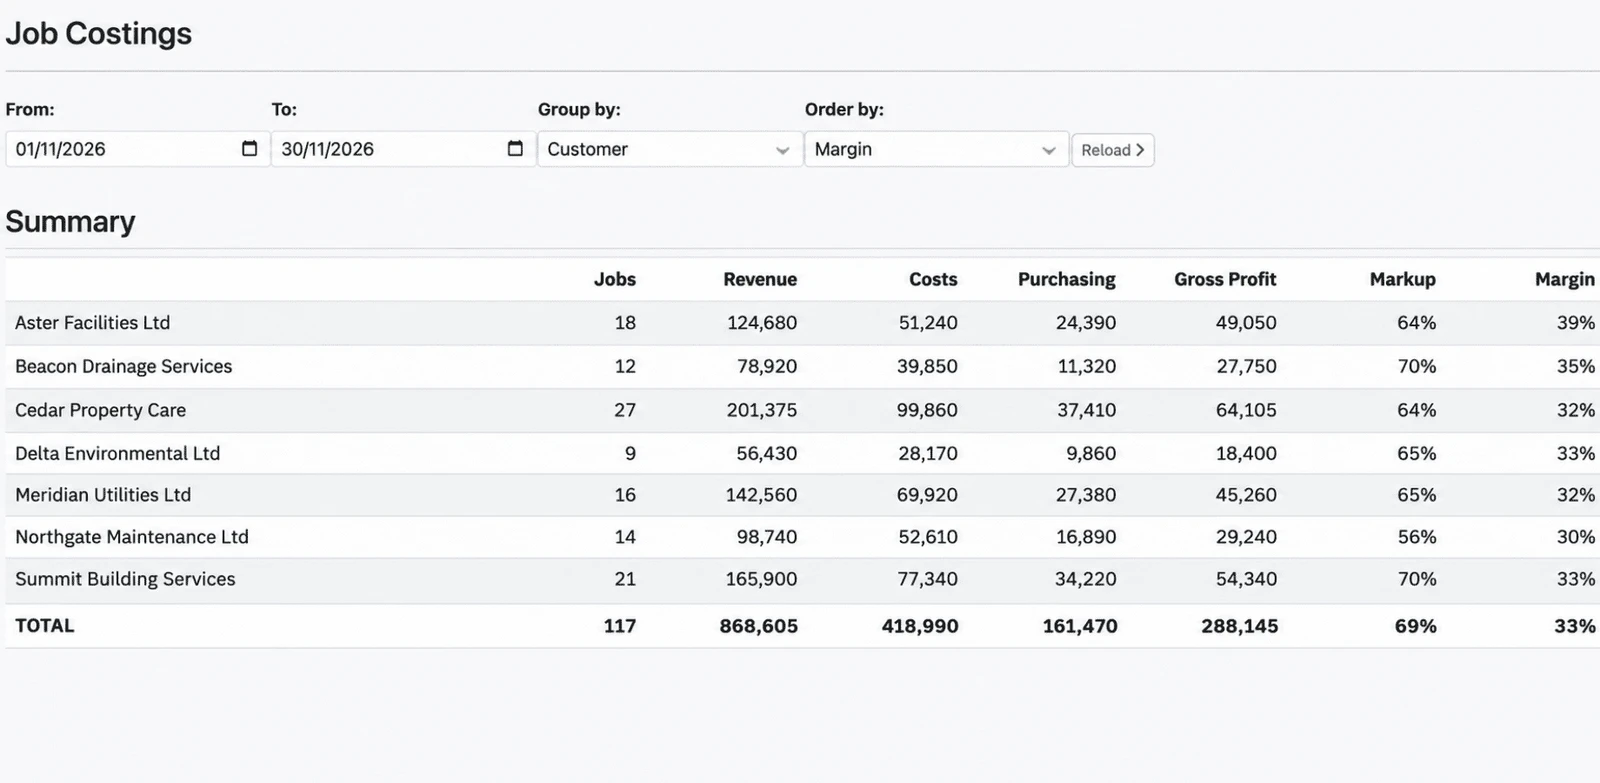
The Job Costings report brings together recorded revenue, costs and purchasing information to calculate gross profit, markup and margin. Results can be grouped by customer, division or job type, with the ability to investigate the individual jobs behind the figures.

A building maintenance company might discover that planned maintenance consistently delivers stronger margins than reactive repairs, even though reactive work generates substantial turnover. Investigating the difference could reveal higher travelling costs, expensive last-minute materials or additional visits that have not been reflected in pricing. Equally, a service previously considered minor might prove to be a dependable source of profit and worth developing further.

The figures are only as useful as the underlying records. Labour, materials, subcontractor costs and purchasing need to be entered consistently, and job costings should not be mistaken for a replacement for formal accounts. Used properly, though, the report gives managers a firmer basis for reviewing quotations, pricing and the mix of work they pursue.

TeamPoint Job Costings report comparing job revenue, costs and profit margins.

Keeping larger projects financially on track

Project profitability becomes harder to judge when a contract involves multiple jobs, sites, suppliers, stage payments and variations. Materials may be ordered long before installation, and different parts of the work may be at different stages of completion and invoicing.

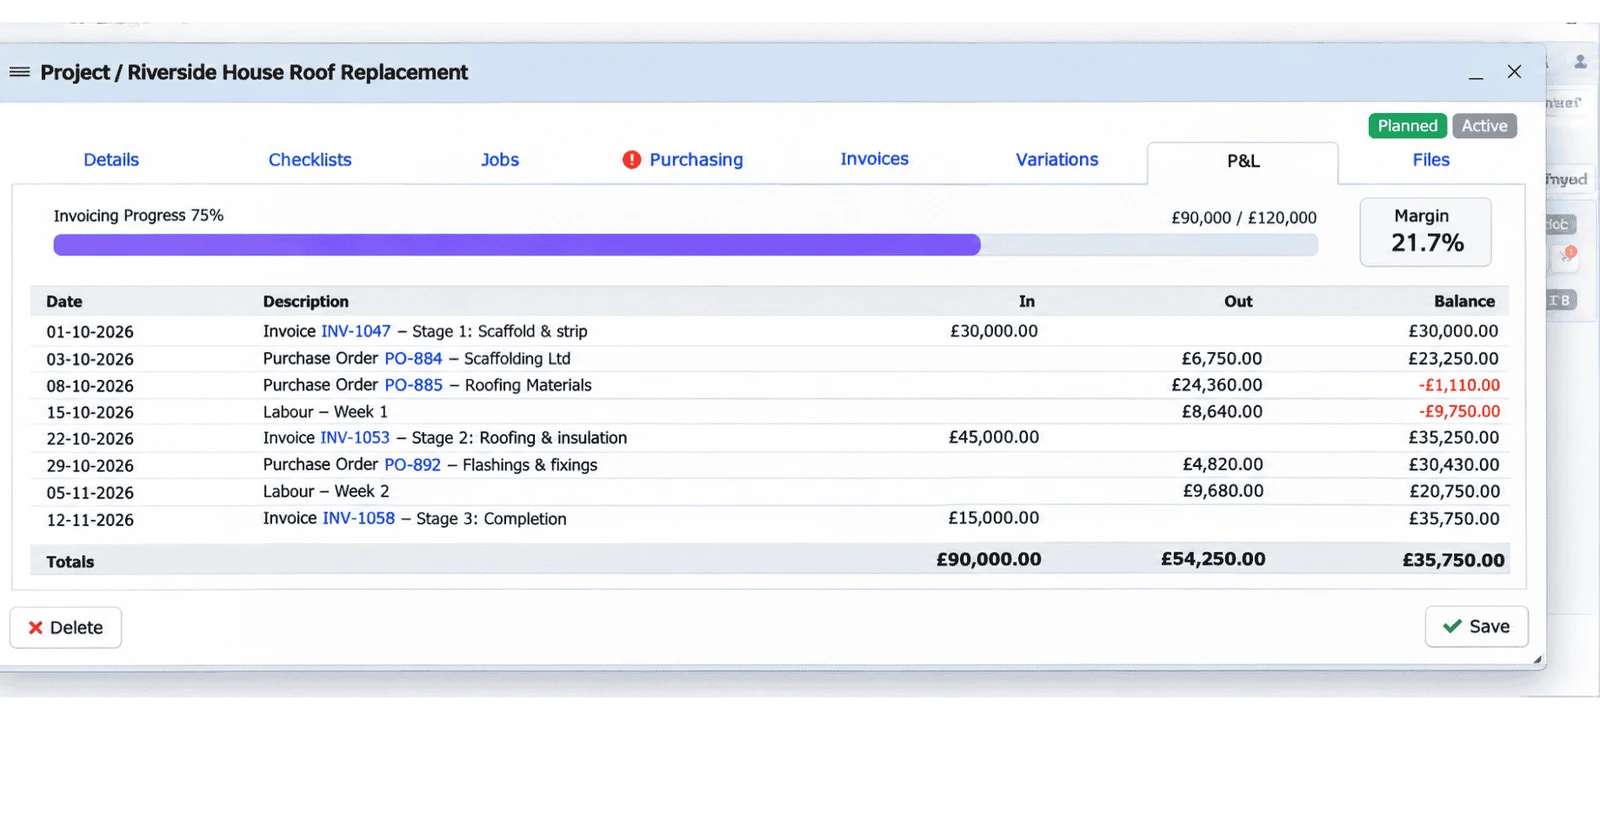
TeamPoint's Project Profit and Loss (P&L) view brings recorded costs, purchasing, invoices and variations together so managers can review the project's financial position as work progresses. A roofing contractor delivering a programme across several properties can examine expenditure, identify unexpected costs and check how much of the agreed value has been invoiced.

A P&L based on recorded activity is not a guarantee of the final contract profit. Its advantage is that it provides an opportunity to investigate issues while the project is still under way, when there may be scope to address purchasing, capture a variation or resolve delayed invoicing.

TeamPoint project profit and loss view showing recorded costs, revenue and margin.

Further reading: From Quote to Completion: Managing Projects with TeamPoint.

Invoicing, purchasing and service contract reports

Profitable work still needs to be invoiced, and expenditure needs managing before it erodes the margin. TeamPoint connects these financial tasks with the jobs and contracts that generate them, helping office and finance teams keep track of what needs action.

From completed jobs to invoices

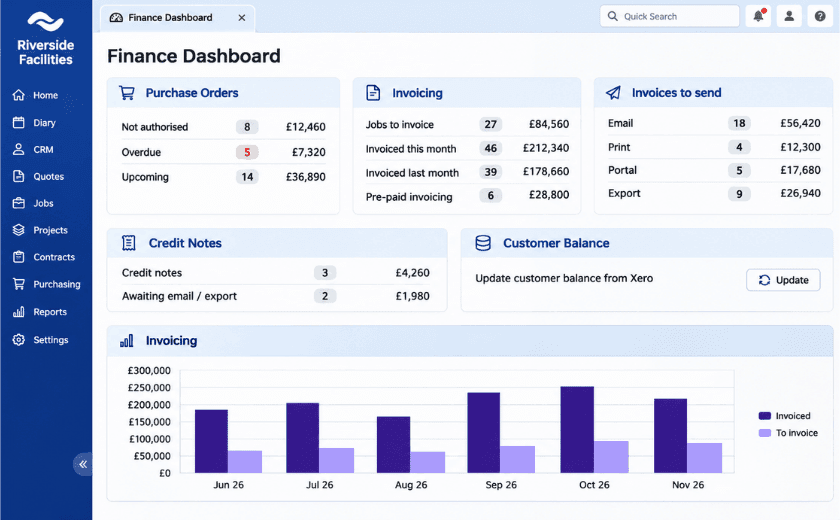
The Finance Dashboard brings together jobs awaiting invoicing, monthly invoicing comparisons, credit notes, purchasing authorisations and invoices that need processing or export. In a business completing hundreds of jobs each month, a few overlooked jobs or delays in paperwork can leave a meaningful amount of revenue waiting to be invoiced.

The dashboard helps distinguish work completed from invoices issued. This is important for cash flow, although invoicing should not be confused with receiving payment.

TeamPoint Finance Dashboard showing invoicing and outstanding financial actions.
Finance Dashboard

The Deposit Payments homepage panel, which can be added from the homepage settings, shows jobs waiting for a deposit and those where payment has been received. This is especially practical when work can be scheduled but must not be dispatched until its deposit invoice is paid. Managers can see which jobs are ready to proceed without checking them one by one.

Planning around recurring contracts

For businesses delivering planned maintenance, Service contracts overview shows active contracts, their values and upcoming service commitments, including a month-by-month view of scheduled activity over the next year. Contract Invoicing gives further detail about prepaid contracts, invoicing frequency, amounts and forthcoming invoice dates. Contract Jobs By Date provides another way to examine work arising from those arrangements.

A facilities management company can use this information to anticipate busy periods across its customer sites, assess the resources required and understand when contract invoices are due. It also provides a clearer picture of the commitments already made before the company takes on additional work.

Purchasing and stock control

Purchasing Forecast helps managers examine purchasing requirements, while the stock reports—Stock Valuation, Stock Forecast By Status, Stock Usage, Van Restock and Warehouse Restock—support decisions about what materials are held, consumed and need replenishing.

This matters when the volume of work increases. Money tied up in excess stock cannot be used elsewhere, while a missing item can disrupt the schedule and lead to a costly return visit. Connecting material requirements and expenditure to planned work makes these decisions easier to manage.

Further reading: From Completed Work to Getting Paid: Invoicing & Payments in TeamPoint.

Measuring growth with Yearly KPIs

Growing businesses often concentrate on turnover, new customers and completed jobs. But a company can become busier without becoming more productive. An equally useful question is how much work and revenue it generates with the resources available.

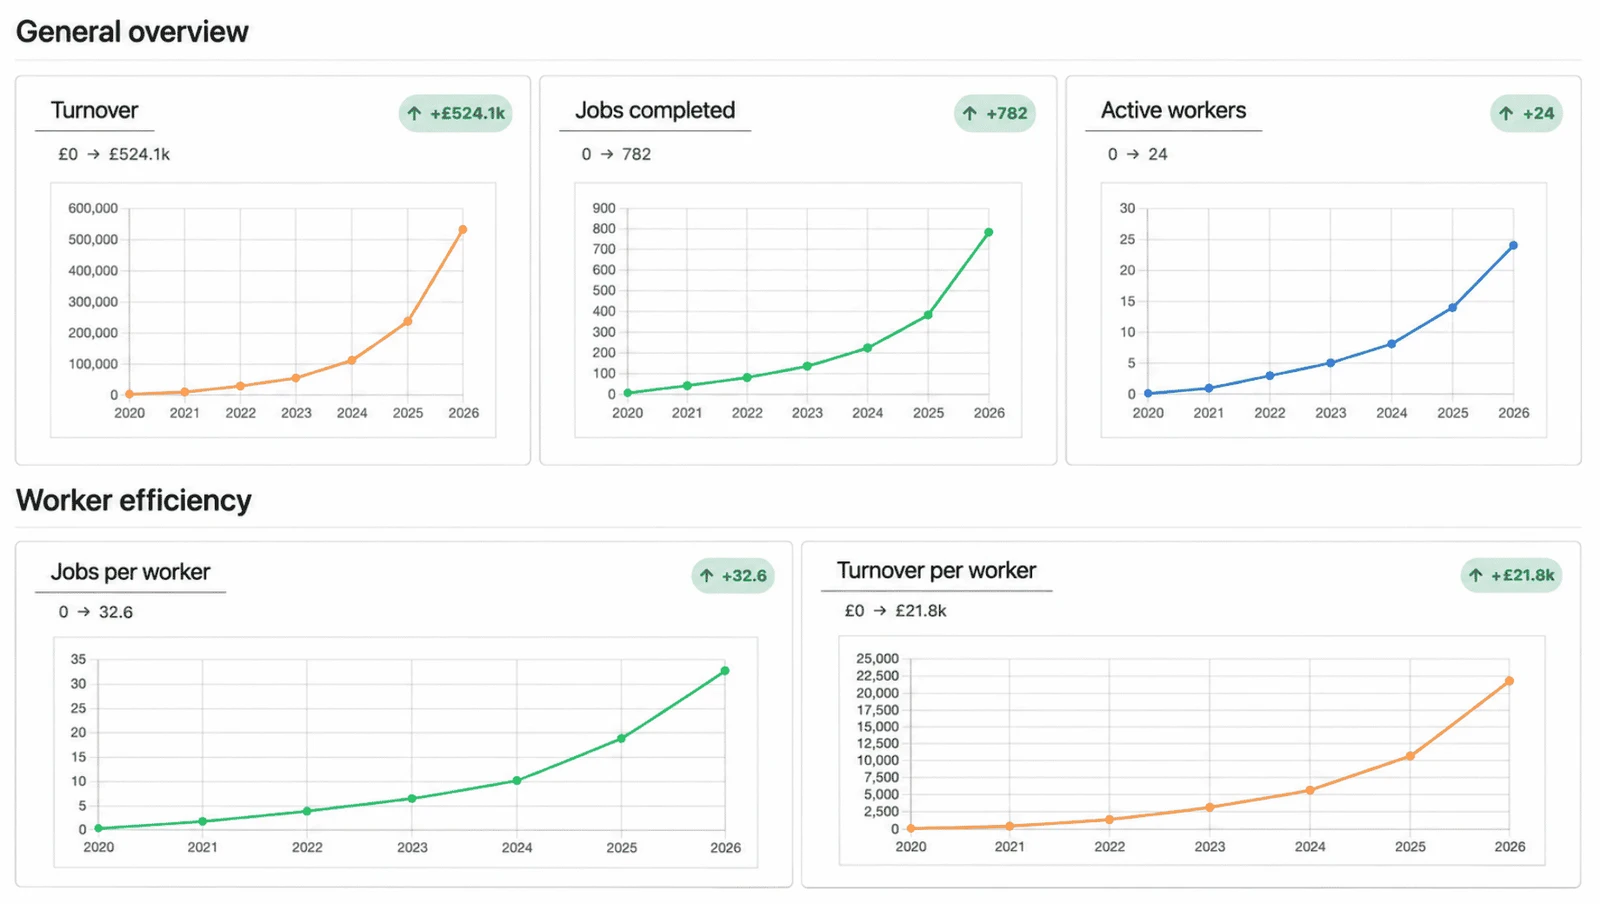
TeamPoint's Yearly KPIs report brings together turnover, completed jobs, active workers, jobs per worker and turnover per worker, making it possible to examine changes across several years. An increase in turnover alongside a larger workforce may be entirely sensible—for example, if a company is investing in future capacity—but comparing the measures helps managers understand what that growth has involved.

In one five-year analysis of a business using TeamPoint, the recorded figures were:

Performance measure

Five-year change

Turnover

+90.9%

Jobs completed

+55.6%

Jobs per worker

+56.9%

Turnover per worker

+92.6%

Travel minutes per job

−21.3%

The most interesting result is not just the increase in turnover. The business was also completing more jobs and generating more revenue per worker, while recording less travelling time per job. These figures describe one business's performance; they are not typical or guaranteed TeamPoint outcomes, and they do not demonstrate that the software alone caused the improvements.

Administrative efficiency is another dimension of growth. As Nik R, Director of Aquarius, described it:

Since installing TeamPoint in 2019 we're doing 3 times as many jobs but haven't needed to recruit any new administrators, saving us at least £50,000 every year.

Nik R from AquariusNik R, DirectorAquarius

Being able to manage a higher volume of work without increasing administration at the same rate can make a substantial difference to costs. Year-on-year reporting gives business owners a way to assess whether changes in staffing, scheduling and processes are producing the results they expected.

TeamPoint Yearly KPIs report comparing business performance across several years.

Dashboards, bespoke reports and business intelligence

Different people need different information to do their jobs well. A business owner may monitor turnover, margins and sales performance; an operations manager needs to know about attendance and outstanding work; a finance manager concentrates on invoicing, purchasing and payments.

Homepage panels can display information relevant to different roles, while the TeamPoint team can help configure dashboards and KPIs around business requirements. Reports draw on the same records the business works from every day, so there is no separate spreadsheet to keep up to date, and access permissions control who can see sensitive commercial or financial information.

The standard reports cover a wide range of requirements, but there will be occasions when a company needs a particular measure or format. Where the necessary information is recorded in TeamPoint, bespoke reporting can be developed, with any additional development work agreed in advance. Reports can also be scheduled for delivery by email, exported in Excel, CSV or PDF formats, and connected to external business intelligence tools where configured. AI-assisted reporting offers another way of exploring recorded business information, subject to the relevant setup and availability.

Where suitable, historical information can be imported from a previous system so that useful comparisons are not necessarily lost during a changeover. The aim is not to give everyone every available figure, but to make relevant information accessible in a form they can use. You can see more on the Business Performance features page.

A clearer picture of the business you want to build

Good decisions depend on understanding both what is going well and what needs attention. A customer spending less may be a prompt for a conversation. Repeated return visits may call for a change in job preparation. A service with strong sales but disappointing margins may deserve a pricing review. Longer-term KPIs can show whether growth is making the business more productive or merely more complicated to run.

These are not separate problems for separate departments. Sales, operations and finance all affect one another, and the information generated in the course of everyday work can help managers understand those connections.

TeamPoint's reporting does not replace experience or judgement. It gives the people running the business evidence they can act on—and a way to see whether their decisions make a difference. For companies looking to protect profitability, maintain good service and grow without losing control, that is a considerable advantage.

TeamPoint's 44 standard reports

The standard reports listed in the November 2026 version of TeamPoint, by category. Access to individual reports can be controlled through user permissions.

Operations

15 reports

Follow jobs from booking to completion: where work stands, how reactive jobs are progressing, when and where jobs are attended, and how reliably and how well they are completed.

  • Job Tracker
  • Reactive Tracker
  • Reactive List
  • Daily Map
  • Job Attendance By Region
  • Daily Performance By Team
  • Operative First Time Performance
  • Job On Time / First Time Performance
  • Customer Ratings
  • Jobs
  • Jobs By Type
  • Jobs By Customer
  • Status History
  • Check Results
  • Daily report

Sales

8 reports

Cover quotations and customers: what has been quoted, won and lost, where work comes from, and how customer spending is changing.

  • Quotes
  • Customer Spend Variance
  • Top Customers
  • Sales by Product
  • Sales by Postcode
  • Sales by Source
  • Quotes by Customer
  • Declined Quotes by Reason

Operatives

6 reports

Show workloads, attendance and qualifications for individual operatives and teams.

  • Jobs By Date / Operative
  • Jobs Per Day
  • Job Totals
  • Job Attendance
  • Team Calendar
  • Operative certifications

Vehicles

1 report

Keeps track of vehicle servicing.

  • Vehicle Services

Finance

6 reports

Cover job profitability, upcoming purchasing, service contract work and invoicing, and long-term KPIs.

  • Job Costings
  • Purchasing Forecast
  • Contract Jobs By Date
  • Service contracts overview
  • Contract Invoicing
  • Yearly KPIs

Stock

5 reports

Cover the value of stock held, forecast requirements, usage, and restocking vans and warehouses.

  • Stock Valuation
  • Stock Forecast By Status
  • Stock Usage
  • Van Restock
  • Warehouse Restock

Admin

3 reports

Help keep records accurate and accountable: activity in the system, notes, and possible duplicate sites.

  • Activity
  • Notes report
  • Possible Duplicate Sites

44 standard reports.

Frequently asked questions about TeamPoint business performance reporting

Help Desk

Still have questions?

Can't find the answer you're looking for? Our friendly UK-based support team is a message away and ready to help.

Talk To Us
TeamPoint includes 44 standard reports across seven categories: Operations, Sales, Operatives, Vehicles, Finance, Stock and Admin. The full directory appears above. Homepage panels, project views and bespoke reporting offer further ways to examine business performance. Access to reports can be controlled through user permissions.
Yes. Job Costings shows recorded revenue, costs, purchasing, gross profit and margins, with results that can be examined by customer, division or job type. Individual projects also have a Project P&L view. Figures depend on the costs recorded in the system.
Yes. TeamPoint records quotation outcomes, and Declined Quotes by Reason helps identify patterns in lost opportunities. Sales by Source, Sales by Product and Sales by Postcode provide further context, while quotation conversion can be considered by number and value.
Yes. Customer Spend Variance compares invoiced customer spending across different periods, taking credit notes into account. Top Customers and Quotes by Customer offer additional perspectives on customer activity.
Yes. The reporting includes Job On Time / First Time Performance, Operative First Time Performance, Daily Performance By Team and attendance reports. Managers can use these views to investigate job delivery, time use and recurring problems.
The Finance Dashboard shows jobs awaiting invoicing and other finance actions. The Deposit Payments homepage panel identifies jobs waiting for a deposit and those whose deposit has been paid, so the office knows which can proceed to dispatch.
Yes. Service contracts overview shows contract values and upcoming activity, Contract Invoicing provides details of prepaid recurring invoicing, and Contract Jobs By Date provides a view of scheduled contract jobs.
Yes. Yearly KPIs includes turnover, completed jobs, active workers, jobs per worker and turnover per worker. Historical data may also be imported where suitable.
Homepage panels can show information relevant to each person’s role, while TeamPoint can configure dashboards around a business’s reporting requirements. Reports can be exported in Excel, CSV or PDF and scheduled for email delivery. Bespoke reports, business intelligence connections and AI-assisted reporting can be discussed and configured to suit requirements; additional development may involve a charge.
Yes. The standard reports are included in TeamPoint. If a business requires a bespoke report that involves additional development, the scope and any charge can be agreed beforehand.

See what TeamPoint could tell you about your business

From the quotations you're winning to the cost of delivering the work, TeamPoint helps you see how different parts of your business are performing—and where there is room to improve.

Explore TeamPoint's Business Performance features or arrange a demonstration to see the reports and dashboards most relevant to your business.

You may also like

TeamPoint connects jobs, invoicing and payments in one system, reducing administration and keeping finances organised.
Platform Capabilities
Written byRosie Cottell

From Completed Work to Getting Paid: Invoicing & Payments in TeamPoint

TeamPoint connects invoicing directly to the jobs, projects and service contracts behind it. From checking completed work and batch invoicing to deposits, stage payments, retentions, recurring contracts, online payments and accounting integrations, the information needed to bill accurately is available in one place, helping the office invoice sooner, avoid missed charges and keep track of money still to come.

02.11.26
Read More
Interconnected structures representing the different stages of a project, bringing people, resources, schedules and costs together.
Platform Capabilities
Written byRosie Cottell

From Quote to Completion: Managing Projects with TeamPoint

From planning and scheduling to purchasing, variations, invoicing and profitability, discover how TeamPoint helps contractors manage projects of every size. Keep track of people, work, costs and compliance, all in one connected system.

20.10.26
Read More
Stylised modernist illustration showing office staff, field operatives, customer communication, job records and ongoing service connected across a field service business.
Platform Capabilities
Written byRosie Cottell

From First Enquiry to Ongoing Service: Managing Customer Relationships in TeamPoint

TeamPoint keeps customer information, communication and work together from first enquiry through to invoicing, repeat service and account reviews. That means quicker answers, clearer records and a more consistent customer experience.

28.09.26
Read More
Organised field service tools, devices and equipment, representing connected job management across office and site teams
Running a Service Business
Written byRosie Cottell

How to Grow Your Service Business Without Losing Control.

Growing a successful service business isn't just about winning more work. It's about making sure your business continues to run efficiently as it becomes larger and more complex. This article explores the habits shared by successful service businesses, from building dependable processes and keeping information connected to managing projects, compliance and business performance. Discover how the right operational approach helps growing businesses stay organised, improve profitability and continue growing without losing control.

16.07.2026
Read More